KPI (Key Performance Indicator) dashboards are a critical tool for businesses to monitor their performance and achieve their goals. A KPI dashboard is a visual representation of key metrics that are essential to the success of the business. It presents data in a format that is easy to understand, allowing decision-makers to quickly identify trends, opportunities, and challenges.
Benefits of KPI Dashboards
- Real-time monitoring: KPI dashboards provide real-time monitoring of critical metrics, allowing decision-makers to quickly identify issues and take corrective action. This is particularly important for businesses that operate in a fast-paced environment, where delays in decision-making can be costly.
- Better decision-making: KPI dashboards provide decision-makers with the information they need to make informed decisions. By presenting data in an easy-to-understand format, KPI dashboards enable stakeholders to quickly identify trends, opportunities, and challenges. This, in turn, enables them to make informed decisions that are based on data rather than intuition.
- Improved performance management: KPI dashboards can help businesses manage performance more effectively. By tracking KPIs, businesses can identify areas that need improvement and take action to address them. This can lead to improved performance and better outcomes.
- Increased accountability: KPI dashboards can increase accountability within the organization. By setting targets and benchmarks, businesses can track their progress towards achieving their goals. This helps to ensure that everyone within the organization is working towards the same objectives.
Tips for Designing an Effective KPI Dashboard
- Define the KPIs: The first step in designing a KPI dashboard is to define the KPIs that are relevant to the business. KPIs should be aligned with the company’s strategic objectives and should be measurable. Our recommendation is to design your KPIs using KPI Karta.
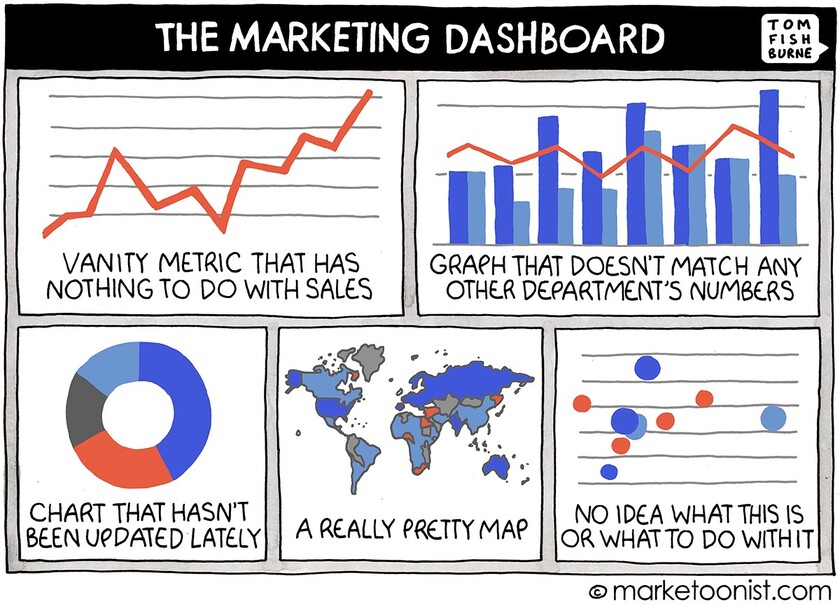
- Keep it simple: A KPI dashboard should be simple and easy to understand. It should be designed with the end-user in mind, and should not include unnecessary information. The dashboard should provide a quick overview of key metrics and allow users to drill down into more detailed information if needed.
- Use visual aids: Visual aids such as charts, graphs, and tables can be used to help stakeholders understand the data presented. Visual aids should be used sparingly and should be designed to be easily understood. Using KPI Karta’s hierarchical visualization allows you to immediately see what is working and what needs further attention.
- Choose the right metrics: KPI dashboards should include the most important metrics that are critical to the success of the business. It is important to focus on metrics that can be directly influenced by the actions of the business.
- Set targets and benchmarks: Once the KPIs are defined, businesses must set targets and benchmarks for each metric. Targets are specific values that the business wants to achieve for the set activities, while benchmarks are a comparison of the business’s performance against industry standards or competitors. These targets and benchmarks should be included in the KPI dashboard to provide context and help stakeholders understand the significance of the data presented.
- Customize for the audience: KPI dashboards should be customized for the audience. A dashboard designed for executives will likely look different from one designed for department heads or front-line workers. The key is to ensure that the information presented is relevant and actionable for the intended audience.
- Update the dashboard regularly: KPI dashboards should be updated regularly to ensure that the data is accurate and up-to-date. This may involve collecting data from various sources, such as financial reports, customer feedback, or website analytics. The data must be accurate, timely, and reliable to ensure that the KPI dashboard is effective.
- Analyze and interpret the data: KPI dashboards provide a wealth of information, but it is up to decision-makers to analyze and interpret the data presented. This may involve identifying trends, anomalies, or areas that require further investigation. The goal is to turn data into actionable insights that can drive business decisions.
- Use the dashboard to drive action: The ultimate goal of a KPI dashboard is to drive action. Once data is analyzed and insights are identified, decision-makers must take action to address issues, capitalize on opportunities, and achieve their goals. KPI dashboards should be designed with this in mind, providing stakeholders with the information they need to make informed decisions and take action.
- Continuously improve the dashboard: KPI dashboards should be continuously improved based on feedback from stakeholders. This may involve adding new metrics, changing the design, or modifying the layout. The goal is to ensure that the dashboard remains relevant and effective in driving business performance.
Recommended Read: Business performance management
Conclusion
KPI dashboards are a critical tool for businesses to monitor their performance and achieve their goals. By providing real-time monitoring, enabling better decision-making, and improving performance management, KPI dashboards can help businesses drive growth and profitability. When designing a KPI dashboard, it is important to define the KPIs, keep it simple, use visual aids, choose the right metrics, set targets and benchmarks, customize for the audience, update regularly, analyze and interpret the data, use the dashboard to drive action, and continuously improve the dashboard. By following these tips, businesses can design an effective KPI dashboard that drives performance and delivers results.


